Tuesday, November 25, 2014
Monday, July 14, 2014
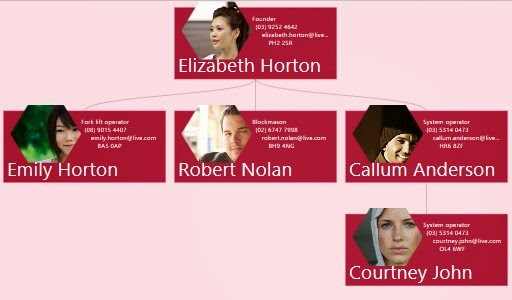
Keyboard Navigating in GetOrgChart
You can navigate in two dimensions in any GetOrgChart. To pan, do one of the following:
- Click and drag the view
- Press the up arrow on your keyboard to move north
- Press the down arrow on your keyboard to move south
- Press the right arrow on your keyboard to move east
- Press the left arrow on your keyboard to move west
- Additionally, you can zoom in or out pressing the + or - keys. Move the cursor over an area of the GetOrgChart and use the mouse scroll button to zoom in or out.
Sunday, July 13, 2014
Friday, April 11, 2014
Orientation and Layouts
GetOrgChart has eight orientation options
Online Demo
getOrgChart.RO_TOP

getOrgChart.RO_BOTTOM

getOrgChart.RO_RIGHT

getOrgChart.RO_LEFT

getOrgChart.RO_TOP_PARENT_LEFT

getOrgChart.RO_BOTTOM_PARENT_LEFT

getOrgChart.RO_BOTTOM_PARENT_LEFT
getOrgChart.RO_RIGHT_PARENT_TOP

getOrgChart.RO_LEFT_PARENT_TOP

Wednesday, April 9, 2014
What's New in GetOrgChart 1.2
GetOrgChart 1.2 Release Notes
Improved: more orientation options
Improved: more orientation options
- getOrgChart.RO_TOP_PARENT_LEFT
- getOrgChart.RO_BOTTOM_PARENT_LEFT
- getOrgChart.RO_RIGHT_PARENT_TOP
- getOrgChart.RO_LEFT_PARENT_TOP
Added: clickEvent event - Called when the user clicks on a person box.
Added: renderBoxContentEvent event - Before the GetOrgChart can be rendered, each box in the control must be bound to a record in the data source. The renderBoxContentEvent event is raised when a data (represented by a GetOrgChart object) is bound to data in the GetOrgChart control. This enables you to provide an event-handling method that performs a custom routine, such as modifying the values of the data bound to the box or modifying the box html, whenever this event occurs.
Added: scale option - The scale factor determines what fraction of the entire scale is visible at one time.
Wednesday, April 2, 2014
Coming soon...
Here are the new extensions that are going to be published on visual studio gallery:
- GetOrgChart for ASP.NET MVC
- GetOrgChart for ASP.NET WebForms
- GetOrgChart Item and Progect Templates
Friday, March 21, 2014
The First Modern Organizational Chart Is a Thing of Beauty

GetOrgChart is a javascript tool to draw organizational charts with amazing ease.
Wednesday, March 19, 2014
How to create an organizational chart in your webpage using GetOrgChart
If you want a quick and easy way to churn out a simple organizational chart that displays on a webpage, this tool is quite useful.

To use it, follow these few steps:
Step 1: Download GetOrgChart and add GetOrgChart files in your project
Step 2: Include this tag in your <head> tag in your HTML file
<script src="http://ajax.googleapis.com/ajax/libs/jquery/1.11.0/jquery.min.js"></script>
<script src="/getorgchart-1.1/getorgchart.js"></script>
<link href="/getorgchart-1.1/getorgchart.css" rel="stylesheet" />
Step 3: Define the <div> tag that will contain the chart inside <body> tag
<div id="people"></div>
Step 4: Add the folloing javascript
$("#people").getOrgChart({
    color: "blue",
    dataSource: [
     { id: 1, parentId: null, Name: "Amber McKenzie"},
     { id: 2, parentId: 1, Name: "Ava Field"},
     { id: 3, parentId: 1, Name: "Evie Johnson"}]
});
Tuesday, March 18, 2014
MVC Demo - Building Your Org Chart Automatically from an Excel File
GetOrgChart can automatically build your organization chart from a list of employees.
Here are the 4 steps for importing Excel data into GetOrgchart:
2. Build an Excel file

3. Create Action method that will read the excel file
GetOrgChartReadFromExcelController.cs
GetOrgChartReadFromExcelController.cs
public JsonResult Read()
{
    //Use OleDb to read the excel
    string path = Server.MapPath(@"~/App_Data/People.xlsx");
    string connString = @"Provider=Microsoft.ACE.OLEDB.12.0;Data Source=" + path + ";Extended Properties='Excel 8.0;HDR=Yes;'";
    DataTable dt = new DataTable();
    OleDbConnection conn = new OleDbConnection(connString);
    OleDbDataAdapter adapter = new OleDbDataAdapter("SELECT * FROM [People$]", conn);
    adapter.Fill(dt);

    //The following code will convert a data table to JSON format.
    List> rows = new List>();
    Dictionary row = null;
    foreach (DataRow dr in dt.Rows)
    {
         row = new Dictionary();
         foreach (DataColumn col in dt.Columns)
         {
              row.Add(col.ColumnName.Trim(), dr[col]);
         }
         rows.Add(row);
    }
    return Json(rows, JsonRequestBehavior.AllowGet);
}
4. Bind the GetOrgChart to the action above
Index.cshtml
var readUrl = "@Url.Action("Read")";

$.getJSON(readUrl, function (people) {
    $('#people').getOrgChart({
        theme: "helen",
        color: "green",
        primaryColumns: ["Name", "Title"],
        imageColumn: "Image",
        linkType: "M",
        editable: false,
        dataSource: people
    });
});
Here is the result:
Download GetOrgChartReadFromExcel ASP.NET MVC application to get started
Please let me know if you have any questions
Sunday, March 9, 2014
Introducing GetOrgChart
GetOrgChart is a javascript library written in pure HTML5/JavaScript, offering intuitive, interactive organizational charts to your web site. An organizational chart (often called organization chart, org chart, organigram, or organogram) is a diagram that shows the structure of an organization and the relationships and relative ranks of its parts and positions/jobs.
Features:
- Editing
- Details view
- Grid view
- Searcing
- Zooming
We have a three design goals.
- Make it really, really, really easy to use
- Simple data strucure
- Quick navigation
For more details please visit our website: www.getorgchart.com
Subscribe to:
Posts (Atom)